

Sullivan County, NY Health Rankings by the Numbers
Since 2010, when the County Health Rankings were first released, Sullivan County has ranked close to the bottom of the list for Health Outcomes in New York State.
Yet as those who live here know, Sullivan County has a lot to offer: beautiful and unspoiled forests, mountains, air and water, gorgeous views, walking trails, and many wonderful and unique attractions and services that draw people from all over.
Locally and regionally grown healthy food is available throughout the county. We have talented and passionate residents who love and care about the county and want to help. Many great initiatives are happening, and more are popping up.
We can work to improve these rankings. Sullivan 180 was created to facilitate this by helping to leverage change in policies and to support new programs.
Sullivan 180 invites the involvement of grassroots activism from the community and partnerships with public health, human service agencies, mental health agencies, local educational institutions, businesses, the arts, and others who will all work together to ultimately improve our Health Outcomes.
How do rankings influence policy and health outcomes?
What are the County Health Rankings?
They are a rankings system developed by a collaboration between the Robert Wood Johnson Foundation (RWJF)* and the University of Wisconsin Population Health Institute.
All counties in the United States since 2010 have received an annual ranking, comparing other counties within each state, but not across states.
The rankings were created to measure the progress toward building a Culture of Health in communities all over the United States.

*RWJF is the nation’s largest philanthropic organization solely focused on health. RWJF supports research and programs that improve health in our communities.

How are the rankings determined?
As the diagram above illustrates, there are a number of weighted measures that are included in two overall categories: Health Outcomes (how long we live and how healthy we feel) and Health Factors which influence the future health of the county (they include Health Behaviors, Clinical Care, Social and Economic Factors, and Physical Environment).
Within these four Health Factor categories there are a number of specific measurable areas identified. The rankings can change from year to year without necessarily reflecting a definite change in health status in any one county for a number of reasons, so it makes more sense to look at trends over time. To understand some of the reasons see Why Ranks Change.
Changes in Policies and Programs impact Health Factors which in turn impact Health Outcomes.
One example of a policy that has resulted in improved health outcomes has been state policy about seat belt use. Most states now have laws in place requiring seat belt use. According to the US Department of Transportation, seat belts have saved an estimated 255,000 lives since 1975. For more examples of policies and programs that work, visit What Works for Health.
Why use this non-traditional approach to measuring health?
You may feel that this is an unusual way of looking at health since it incorporates more than traditional sickness (morbidity) and death (mortality) measures.
For example, 40% of the weight of Health Factors are social and economic and include education, employment, income, etc., and 10% of the weighting (Physical Environment) includes “Housing & Transit” as a specific factor.


Why are non-health statistics a factor in determining health rankings?
The reason for including non-health measures makes sense once you know that many factors have been shown to impact health.
For example, there are multiple studies linking a shortened life expectancy to low income, and in communities where there is an unequal distribution of wealth, the life expectancy of those with a lower income is even shorter.
For more information on health equity and differences in health status according to income and other factors.
Sullivan County Health Outcomes & Factors


Health Disparities
Children’s health is disproportionately impacted by poverty, and children can suffer the impacts of poor health throughout their lives, even when they no longer are children and have a higher income*.
The chart shows that the percentage of children living in poverty in Sullivan County (red line) has steadily increased since 2002 and is far higher than for New York State (green dotted line) and for the United States (blue dotted line) as a whole.

Source: NYSDOH County Health Indicators by Race/Ethnicity (CHIRE), 2021 https://www.health.ny.gov/statistics/community/minority/county/county_list.htm
Striving for Health Equity
Sullivan 180 is committed to supporting interventions like these and others to promote smart and effective change toward better health for the greatest number of county residents in the least amount of time.

The connection between health and race is displayed in the chart above.
It starkly shows that African-Americans and Latinos in Sullivan County die far earlier than White residents, as a rule.
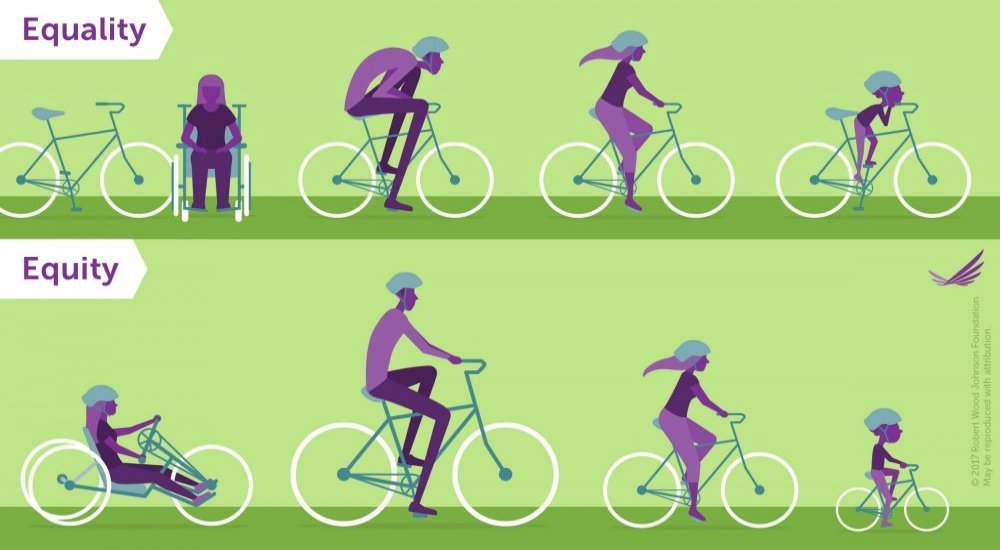
As this graphic about equality vs. equity demonstrates, one size does not fit all.
Some people and communities may need additional support to be able to fully enjoy access to a healthy lifestyle and good health.
Let’s work together to make sure everyone in Sullivan County can enjoy better health.
“Where we live shouldn’t determine how long or how well we live.”
In our communities, we all should be surrounded by conditions that enable us to live the healthiest life possible, such as access to healthy food, quality schools, stable housing, good jobs with fair pay, and safe places to exercise and play.
Unfortunately, in many communities, there are persistent barriers to health and opportunity to thrive. Factors such as our race, ethnicity, and socioeconomic status should not play a role in how healthy we are or how long we live. Unfortunately, for many of us, they do.
— Robert Wood Johnson Foundation, 2018

Poverty in Sullivan County, NY
In Sullivan County, as in other places, low income usually affects the ability to live in dignified housing, the ability to pay utility and heating bills, to own a reliable car (essential for rural living), to afford enough to eat, to be able to afford medical appointment copays and deductibles, and more.
And even with the Affordable Care Act making it possible for low income people to purchase affordable health insurance, dental insurance for adults remains expensive and unaffordable for many.
According to the New York State Community Action Association’s 2018 New York State Poverty Report, Sullivan County‘s poverty rate is 17.5% of all residents combined compared to 15.5% of all New Yorkers living in poverty. But that is only part of the story.
As you can see from the charts above, Sullivan County African-American residents are more than twice as likely to be poor as White residents, while Latino residents are almost twice as likely.


Poverty Effects Damaging to Our Communities
When people’s lives are impacted by poverty, day-to-day survival can be a struggle, and essentials for good mental and physical health, like exercise, leisure and enjoyment, can seem like luxuries.
Mental and physical health are adversely impacted by the stress of poverty and by the stress, in some cases, of racism or prejudice in everyday life.
For example, not being called in for a job interview because the last name on the application is Latin sounding, being followed by security staff while shopping because of one’s race, or not being hired after a job interview because the person has disclosed he or she is LGBTQ+ during the interview.
These charts and tables are shocking and display a disparity in Sullivan County caused mainly by poverty, lack of opportunity, structural racism, and more.
These differences are not unique to Sullivan County, NY, and are, in fact, common throughout the United States.
The GOOD news is that these disparities do not have to be permanent.
Sullivan 180, with our countywide partners, is committed to ensuring that everyone, no matter who they are, can enjoy health and happiness at the same level as their fellow county residents.
As the US Centers for Disease Control (CDC) states in their HI-5 or “Health Impact in 5 Years” Document: Programs that address the conditions in the places where we live, learn, work and play have the greatest potential for keeping people healthy.
Here are some recommended and proven non-clinical interventions from that document.


Social Determinants of Health (addresses the conditions in the community)
Early Childhood Education
Clean Diesel Bus Fleets
Home Improvement Loans and Grants
Earned Income Tax Credits
Water Fluoridation
Making the Healthy Choice the Easy Choice (changes the content to make healthy choices easier)
School-Based Programs to Increase Physical Activity
School-Based Violence Prevention
Safe Routes to School
Motorcycle Injury Prevention
Tobacco Control Interventions
Access to Clean Syringes
Pricing Strategies for Alcohol Products
Multi-Component Worksite Obesity Prevention

“The county health ranking is a number, and we get easily stuck and frustrated by that number in Sullivan, but the stakes are too high, and our children deserve better.
While we have great need here, we also have incredible prevention programs and interventions that can make a significant difference if our people are connected to them.
All families, no matter who they are, where they live, or how much money they make, should have the resources they need to help their children grow up healthy.”
— Amanda Langseder, Senior Director of Prevention Programming, Sullivan 180